
When an LLM gives an incorrect answer, the final log usually contains only the output. The retrieval result, prompt version, tool call, model call, and generation path are outside the log record, making it hard to isolate the actual cause.
LLM root cause analysis means opening the full trace and finding the first span where the request went wrong. A trace keeps each step separate, so you can see whether the failure came from retrieval, prompt assembly, tool execution, model configuration, or generation.
This guide shows how to reproduce the failure, find the right trace, inspect the trace tree, isolate the failing layer, and turn the production failure into a regression test so the same error is checked before future releases.
Why logs fall short for LLM root cause analysis
When a production assistant returns the wrong refund window, the visible failure is only the final answer. The actual cause may sit earlier in the execution, where the system retrieved policy text, assembled the prompt, called a model, or passed arguments to a tool. A standard application log can confirm that the customer saw the wrong answer, but it rarely preserves the intermediate steps well enough to explain which one failed.
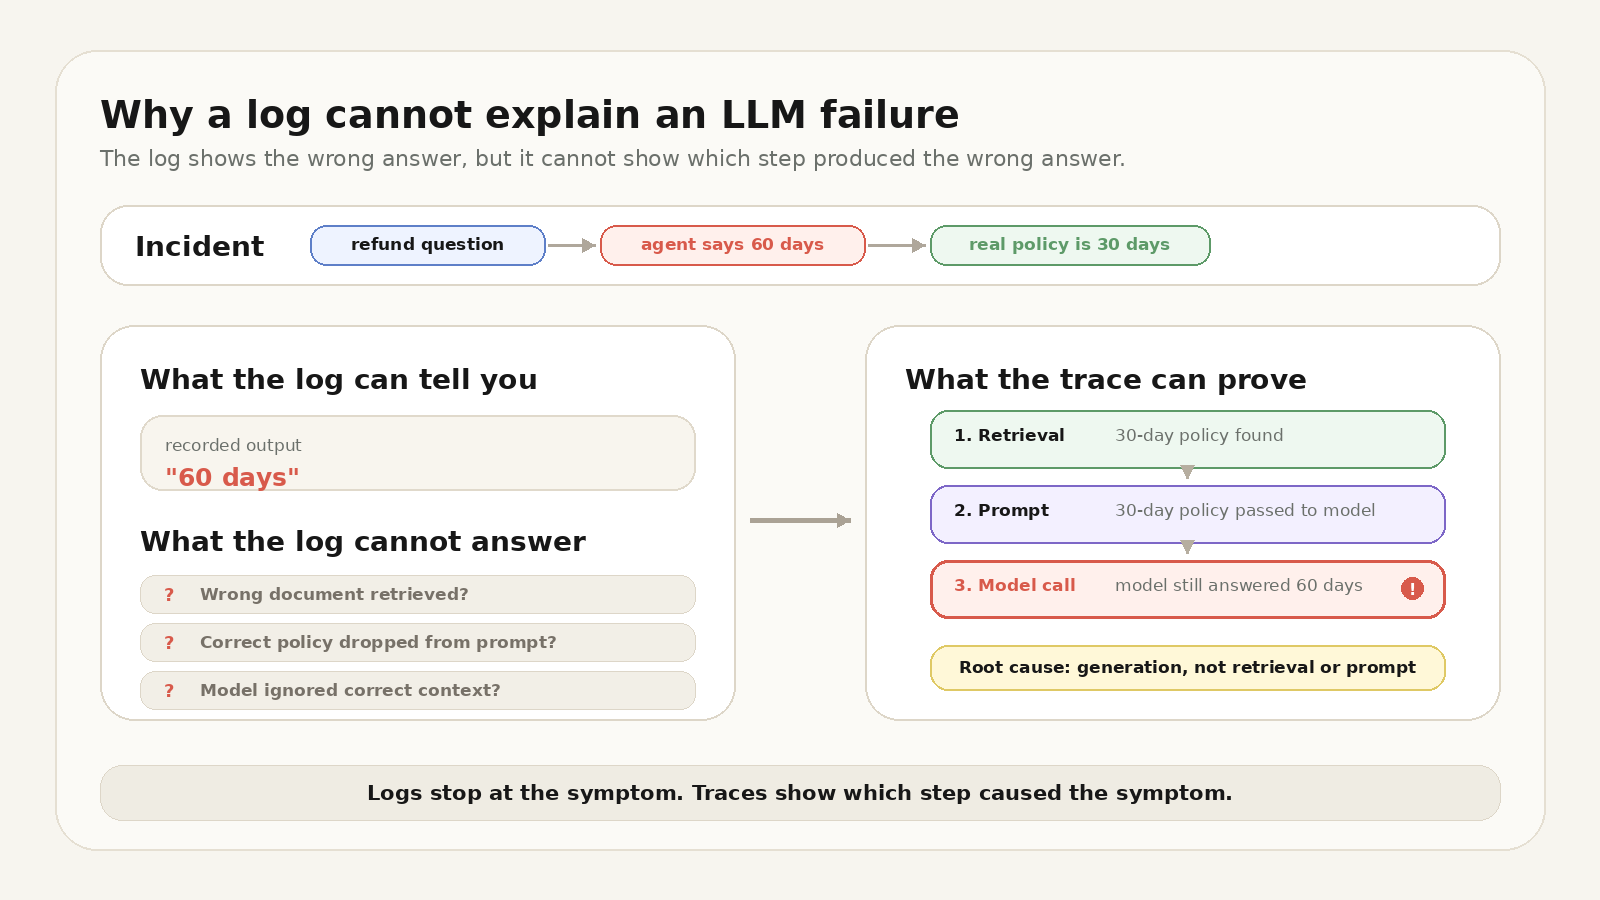
A log captures the bad output, while a trace keeps the intermediate spans needed to identify the failing step.
Logs fall short because an LLM answer is the last step in a chain. Before the model produced the refund response, the application may have retrieved a policy document, inserted that document into a prompt, selected a model, and called one or more tools. When those steps are collapsed into one output string, the investigation starts and ends with the same incorrect answer. The retrieval result, rendered prompt, tool arguments, model configuration, and generation output are not available as separate evidence.
Missing span-level data becomes harder to work around because LLM behavior can change across retries. The same user question may take a different retrieval path or yield a different answer on the next run, so a log line alone does not provide engineers with enough evidence to reproduce the failure. Root cause analysis requires the execution to be recorded as a trace tree, where each step has its own input, output, and metadata.
Braintrust captures that trace tree for every AI call, including the complete input prompt, model output, token counts, latency, cost, model configuration, and request and response metadata. With those details attached to each span, a vague report like "the agent is wrong sometimes" becomes a specific production trace with a failing span that an engineer can inspect.
Step 1: Reproduce the failure and locate the trace
The first step in an LLM incident is locating the exact request that failed among the requests that worked. Start with the signal from the incident report: the affected user, session, error, timestamp, or a snippet of the bad output. In Braintrust, you can filter logs via the UI, CLI, or API, and the same filter expressions apply across all entry points.
Most incidents can be narrowed with a few common filters:
- When the report includes an affected user, filter on the user identifier you logged as request metadata.
- When the failure produced an exception, filter for errored runs.
- When the only clue is a phrase from the wrong answer, search the text fields.
- When the report gives only a rough time, scope the query to a recent window.
metadata.user_id = "user-123"
error IS NOT NULL
search('timeout')
created > now() - interval 1 day
Filtering by user or session depends on the metadata recorded upstream, so incident response quality depends on the identifiers attached when the request was logged. Once the filter returns the failed request, open the full trace rather than inspecting the matching span in isolation. Every span carries a root_span_id, and using root_span_id takes you to the full execution tree for the request.
If writing a filter slows the investigation down, Loop can help from the Logs page. A team member can describe the failure in plain language, such as "Why did this request fail?", and Loop can surface relevant traces without requiring every investigator to write the query manually.
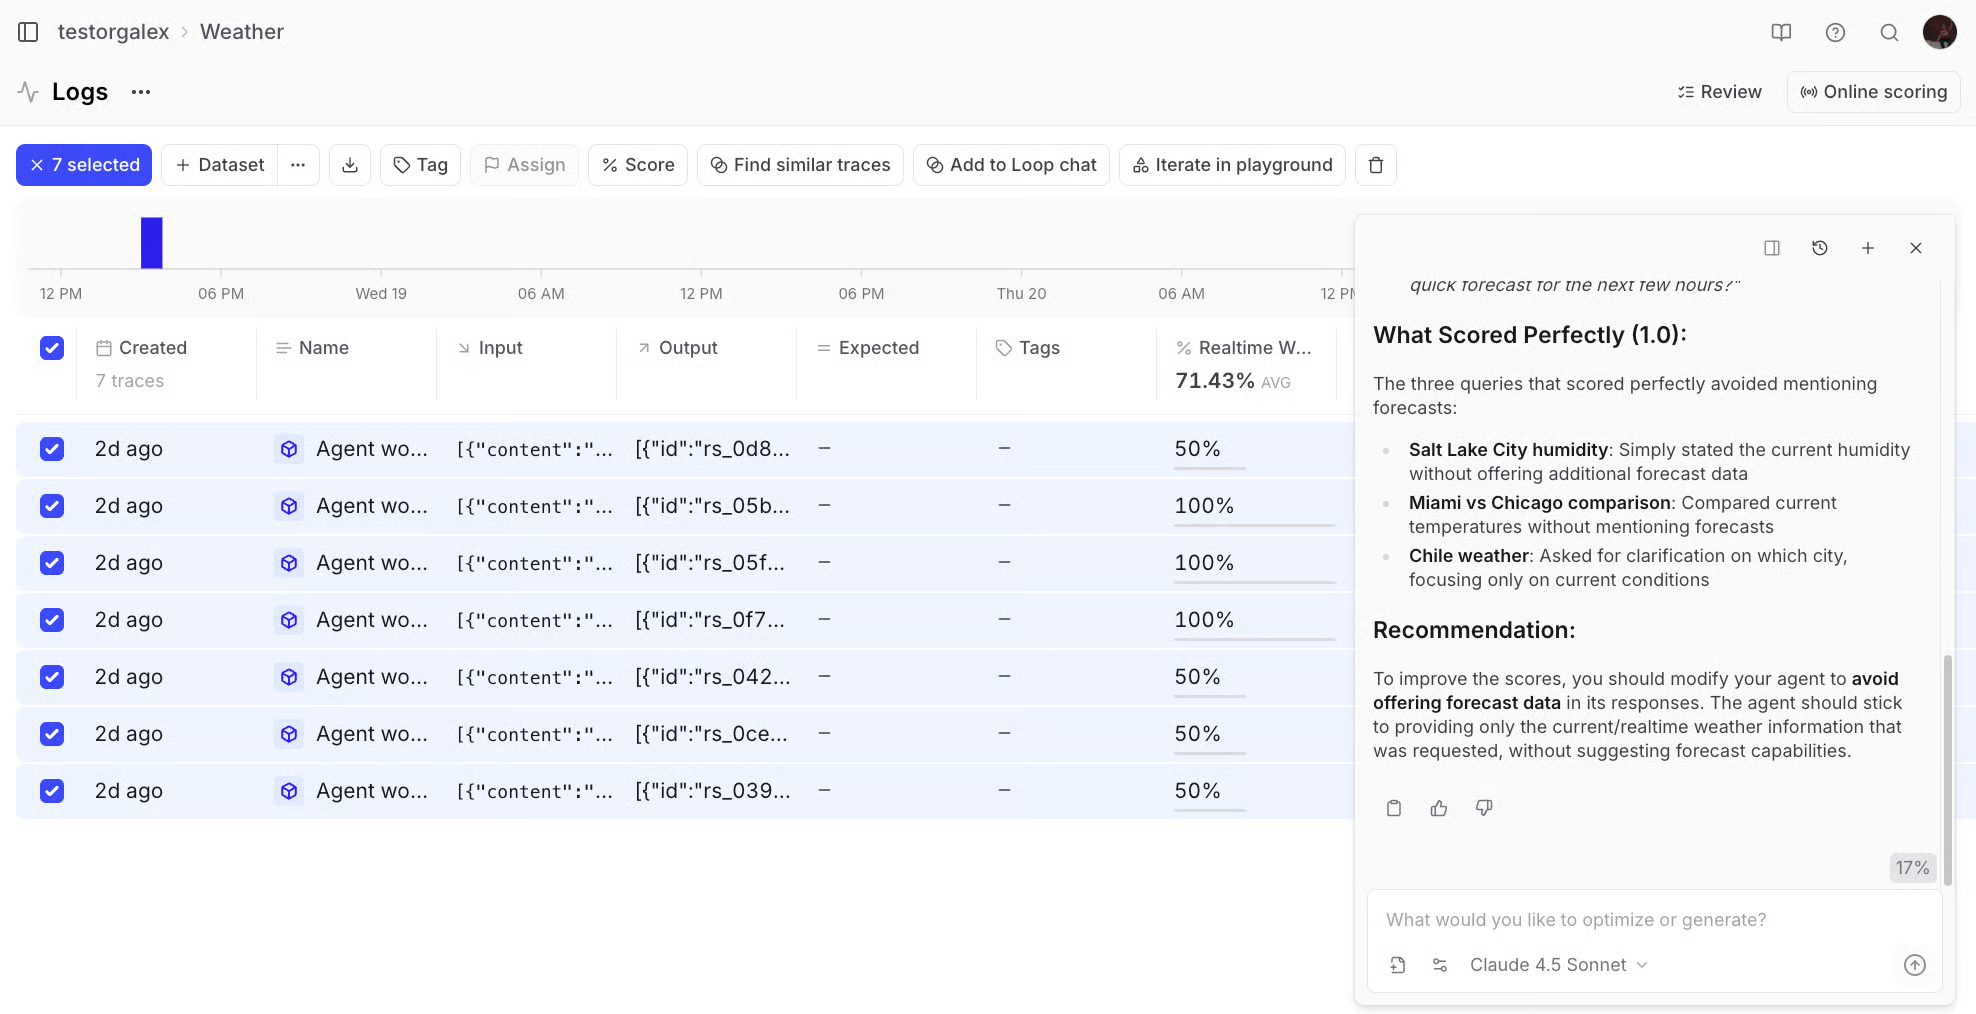
Before moving into the trace, confirm that the request matches the incident report. Check the input, timestamp, affected user or session, and final wrong output so the rest of the investigation follows the actual failed request rather than a similar one.
Step 2: Walk the trace tree to the failing span
After you open the failed request, read the trace as the execution path the application actually followed. A Braintrust trace is organized as a parent-child tree, where retrieval, prompt assembly, model calls, and tool calls appear as separate spans. Each span retains its own input, output, and metadata, so the investigation can proceed step by step rather than treating the response as a single opaque event.
Walk the spans in order and compare each span's output with the output that step should have produced. The goal is to find the first span where execution diverged, because downstream spans may only carry forward an earlier mistake. In the refund example, the retrieval span is the right place to start. If retrieval returned the correct policy document with the 30-day refund window, retrieval is not the root cause, and the investigation can move to prompt assembly and generation.
When the trace is too deep to inspect manually from top to bottom, filter for conditions that can appear anywhere in the tree. ANY_SPAN() lets you find traces where a specific span type, error, or metadata value exists below the root, which is useful when you know the kind of failure but not the exact span that contains it. Combine the conditions inside a single ANY_SPAN() call so the type and the error match on the same span rather than on different spans in the trace.
ANY_SPAN(span_attributes.type = 'llm' AND error IS NOT NULL)
Loop can also help with the first pass through an unfamiliar trace. From an individual trace, a prompt such as "Summarize this trace" can give the team a quick orientation before an engineer inspects the relevant spans directly.
Step 3: Isolate the failing layer
Once you identify the failing span, the next decision is which layer caused the failure. The fix depends on the layer: a retrieval issue needs different work than a prompt assembly issue, a malformed tool call, or a model output that ignored correct context. The span metadata gives you the evidence to separate those cases.
Prompt version: Check which prompt version was rendered for the failed request. When the prompt version is logged as metadata, you can filter between old and new versions to see whether a recent prompt edit aligns with the failure.
Retrieved context: Inspect the input to the model-call span and confirm which context actually reached the model. Correct retrieval does not guarantee correct model input, because prompt assembly can drop, reorder, or truncate documents before generation.
Tool call or arguments: For an agent failure, inspect the tool spans and compare the arguments sent to the tool with the value returned by the tool. Wrong arguments, malformed calls, and tool errors usually show up directly in the tool span.
Model version: Check which model and version served the response. Filtering by model metadata can confirm whether a model change lines up with the start of the failure.
metadata.environment = "production" AND metadata.model = "gpt-5-mini"
In the refund example, the layer isolation is straightforward. Retrieval returned the correct 30-day policy, the current prompt version rendered correctly, the model-call input included the right policy text, and no tool produced the answer. With the upstream layers cleared, the failure belongs to generation: the model received the correct policy and still answered with 60 days. That finding keeps the fix focused on grounding the model output or changing the model, rather than reworking retrieval or prompt assembly.
Step 4: Confirm the fix and lock it with a regression test
A root cause is not confirmed until the same failing input passes with the proposed fix. Re-run the original request against the change, whether the fix is a tighter prompt instruction, a stronger grounding requirement, or a model change, and inspect the new trace to verify that the answer is correct for the right reason. Comparing the original failing trace with the fixed trace separates a real fix from a lucky retry.
The fix also needs to be added to the test set. When a production failure is only recorded in an incident note or a developer's memory, the same failure can recur after a subsequent prompt, retrieval, or model change. In Braintrust, you can promote the failing trace into a dataset directly from the logs:
- Go to Logs.
- Select the traces you want to add.
- Select + Dataset and then the dataset you want to add to.
Promoting the trace maps the span input to the dataset row input and the span output to the expected value, thereby making the exact production request a reusable test case. Braintrust also supports a programmatic path with the BTQL endpoint to fetch the span and the dataset insert API to add it. The origin field links each dataset row back to the source span, keeping the test case connected to the production failure that created it.
The dataset turns incident response into evaluation coverage. A Braintrust evaluation runs the AI function under test against dataset rows and scores the outputs, so the failed production request can be checked automatically after the fix. Running that evaluation in CI makes the failure part of the release process, where future changes must pass the same case before they ship.
Common LLM failure signatures
Most production LLM failures become easier to diagnose once you know which trace evidence to inspect first. Use the reference below during an incident to connect the visible symptom to the span that usually contains the root cause.
| Failure signature | Symptom in production | Trace evidence to inspect | Likely root cause | Fix direction |
|---|---|---|---|---|
| Hallucination despite correct retrieval | The answer is fluent and confident but contradicts the source data. | Retrieval span contains the correct document, and the model-call input includes the correct context, but the model output diverges from it. | Generation failed even though the upstream context was correct. | Tighten grounding instructions, require the model to quote or cite the retrieved value, add the case to an eval, or test a stronger model. |
| Retrieval miss | The answer is wrong because the model never received the right source material. | Retrieval span returns irrelevant, stale, incomplete, or low-ranked documents for the user request. | Retrieval selected the wrong context before prompt assembly began. | Improve retrieval filters, embeddings, ranking, chunking, metadata, or source freshness. |
| Context truncation | The answer ignores information that was retrieved correctly. | Retrieval span looks correct, but the model-call input is missing part of the retrieved context. | Prompt assembly dropped, reordered, or truncated the relevant document content. | Review token limits, document packing, context ordering, and prompt construction. |
| Tool argument error | The agent loops, stalls, or returns a result that does not match the user request. | Tool span shows the wrong argument, a malformed payload, a validation error, or an unexpected tool return value. | The agent called the right tool incorrectly, or the tool returned an unusable result. | Fix argument construction, add validation before tool execution, and evaluate tool-use cases separately. |
| Prompt version regression | A behavior that used to work starts failing after a change to the prompt. | Span metadata shows a new prompt version that lines up with the first failures. | A prompt edit changed the instruction, formatting, or grounding behavior. | Compare prompt versions, roll back or revise the prompt, and add the failed case to the regression dataset. |
| Model version regression | Similar requests start failing after a model change or routing change. | Span metadata shows a model or provider version change near the start of the failures. | The new model handles the task, instruction, or context differently. | Compare outputs across model versions, update eval thresholds as appropriate, and gate future model changes based on the failed case. |
Start free with Braintrust and turn every incident into a regression test that keeps the same failure from reaching production again.
FAQs: how to trace an LLM failure back to its root cause
Logs vs. traces for debugging LLM failures, which do you need?
Logs are useful for finding failed requests, while traces are what engineers use to diagnose failures. In Braintrust, logs and traces stay connected, so a team can start from a production issue, open the related trace, and inspect the spans that shaped the final response. The cleaner operating pattern is to use logs for discovery and traces for root cause analysis.
How do I find which version of the prompt caused the failure?
Start by checking whether failures cluster around a specific prompt version, rather than whether a single failed request used the latest prompt. Prompt version metadata can be attached to Braintrust traces and used in log filters, which makes it easier to compare behavior before and after a prompt change. A prompt edit is the likely cause when failures increase after the version change, while similar requests still pass on the earlier version.
Can I replay a failed LLM trace?
A failed trace gives you the captured input and execution context needed to rerun the case against a proposed fix. With Braintrust, the stronger pattern is to promote the trace into a dataset, then run it through an evaluation so the replay becomes repeatable. Model randomness, external tools, and retrieved content can still affect a new run, so compare the fixed result against the original trace and the expected behavior.
How do I stop the same failure from recurring?
Turn the failure into a regression case with a clear expected outcome and a scorer that checks the behavior you care about. Braintrust turns production traces into dataset rows for evaluations, then supports CI checks before release. That gives teams a structured way to make sure a fixed prompt, retrieval flow, tool call, or model route does not reintroduce the same failure later.